
| SDOH Action Tool Home | Health Outcomes Dashboard | SDoH Drilldown Dashboard | Community Comparison Dashboard |
Social Determinants of Health (SDoH) Action Tool
The Social Determinants of Health (SDoH) Action Tool is a data visualization tool that helps organizations and individuals better understand and find solutions based on which SDoH factors—such as food insecurity, neighborhood walkability, and teenage birth rates—are affecting population health at the local level.
The SDoH Action Tool, named a semi-finalist in the Agency for Healthcare Research and Quality's Visualization Resources of Community-Level SDoH Innovation Challenge, helps users make informed decisions to improve health care access, quality, and equity. The Tool is comprised of three user-friendly dashboards that allow for nuanced geographical analyses across a broad array of SDoH variables that empower users to identify population-level challenges and interventions to address these challenges.
Start your exploration by viewing the tool's three dashboards below.
|
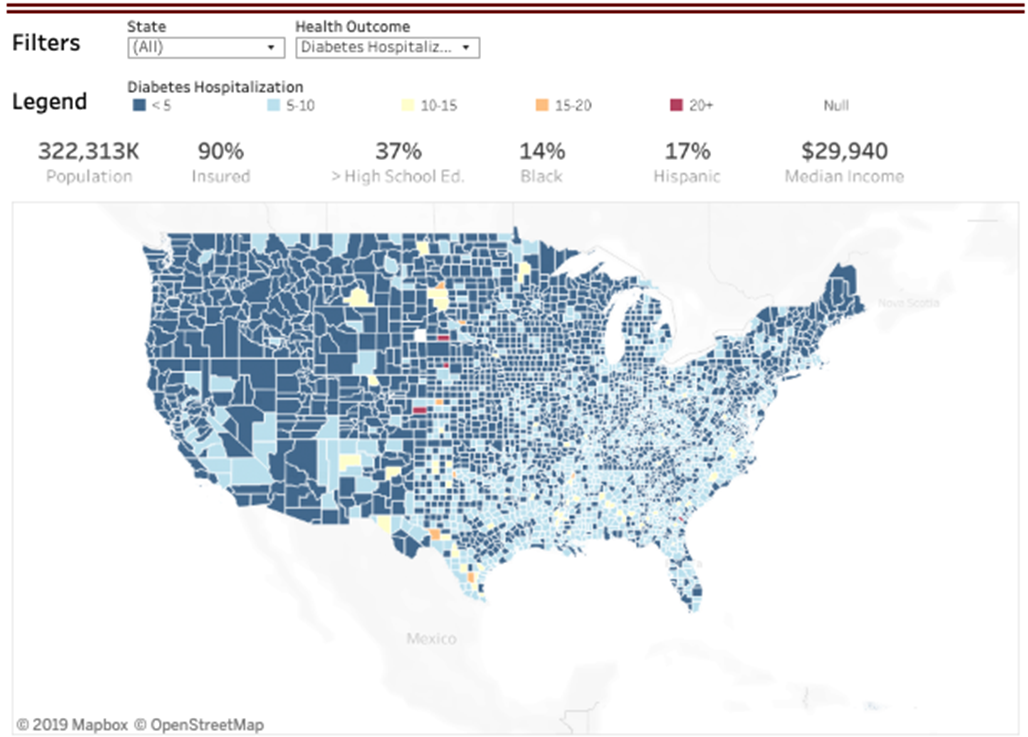
1. Health Outcomes DashboardVisualizes health outcomes geographically and highlights associated social indicators.
|
Use CaseA local government official seeks to provide evidence-based research on what influences a specific health outcome in their community. A county health official is tasked with curbing the rise of diabetes in their county. The official wants to gain a deeper understanding of the SDoH measures known to influence diabetes prevalence. The knowledge gained will inform future programming initiatives and policy implementation in the official's community. The Health Outcome Dashboard will allow the official to explore which SDoH measures contribute to diabetes and will provide a user-friendly platform for visualizing SDoH across census tracts. With use of this Dashboard, the official will learn that healthy food access and neighborhood walkability are contributing factors to diabetes prevalence. Equipped with this evidence-based information, the county health official can implement effective programs and policy to decrease diabetes prevalence in their community.
|


|
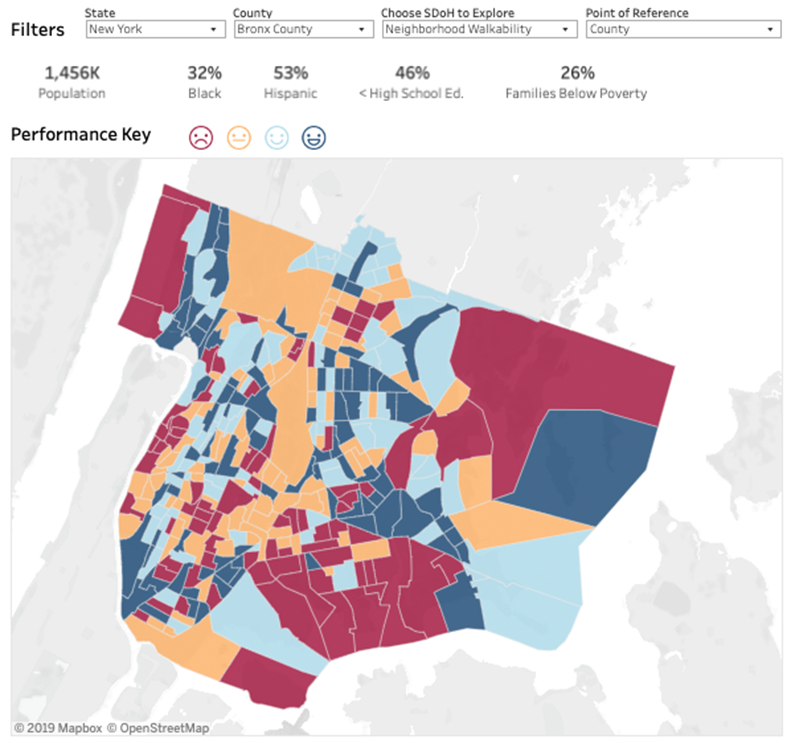
2. SDoH Drilldown DashboardVisualizes social determinants of health geographically with associated social indicators.
|
Use CaseA Community-Based Organization (CBO) focused on a specific SDoH measure seeks to prioritize targeted communities and make a case for their work. A CBO is focused on increasing neighborhood walkability, a measure defined by the characteristics of the built environment that influence the likelihood of a resident walking as a mode of travel. The CBO is interested in applying for a grant that funds public health programming initiatives in underserved communities. The CBO needs to identify communities in their jurisdiction with low neighborhood walkability scores and data that supports their initiative before applying for grant funding. The SDoH Drill Down Dashboard addresses the CBO's challenges by enabling them to compare the varying neighborhood walkability scores across census tracts or counties in their jurisdiction. The CBO could thus use this tool to inform their priority metrics when identifying underserved communities and effectively allocate resources when budgeting for programming initiatives. This dashboard provides a user-friendly approach to collecting evidence-based information, which can strengthen the CBO's grant application.
|

|
|
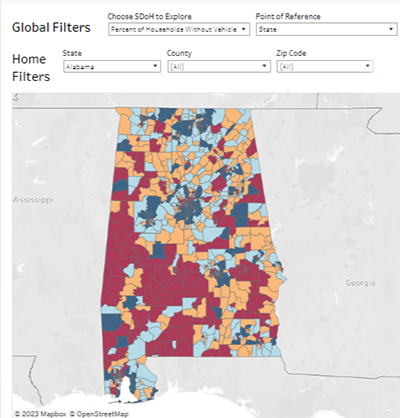
Use CaseA state health official needs to know how communities in their state compare on a specific SDoH measures. A state health official of Delaware is focused on decreasing the state's teenage birth rate and wants to see how Delaware compares to neighboring states on that SDoH. The Community Comparison Dashboard displays how a county (and census tracts within it) compare with others (neighboring or exemplary) on SDoH variables, such as teenage birthrate. Using the Community Comparison Dashboard, the state health official learns that neighboring states have a lower teenage birth rate compared to Delaware. With this knowledge, the official contacts the neighboring states' public health departments to see what programs they have implemented to target this SDoH and better inform Delaware's programming initiatives.
|

Access the detailed user guide here